"""2024-12-21
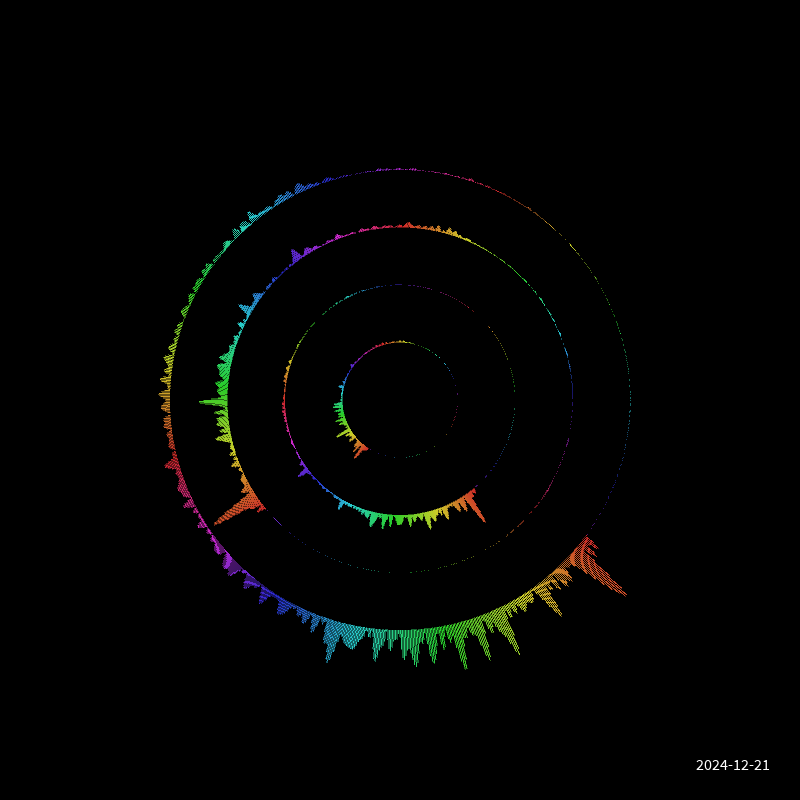
Vendo o Som 2 - Think (Information Society)
Exercício de visualização de som com círculos
png
Sketch,py5,CreativeCoding
"""

import math

import numpy as np
import py5
import sounddevice as sd

from utils import helpers

sketch = helpers.info_for_sketch(__file__, __doc__)

MARGEM_X = 200
MARGEM_Y = 200


CIRCULOS = 4
ALL_DATA = []
DEVICE = 0
GAIN = 20
BLOCK_DURATION = 10

CAPTURAS = 360


def capture_sound(total_points: int):
    data = []
    samplerate = sd.query_devices(DEVICE, "input")["default_samplerate"]
    low, high = [100, 2000]
    delta_f = (high - low) / (80 - 1)
    fftsize = math.ceil(samplerate / delta_f)

    def callback(indata, frames, time, status):
        if any(indata):
            magnitude = np.abs(np.fft.rfft(indata[:, 0], n=fftsize))
            magnitude *= 10 / fftsize
            data.append(magnitude)

    with sd.InputStream(
        device=DEVICE,
        channels=1,
        callback=callback,
        blocksize=int(samplerate * BLOCK_DURATION / 1000),
        samplerate=samplerate,
    ):
        while len(data) < total_points:
            print(f"{len(data)}/{total_points} ({samplerate})")
    return data


def circulo(mult, data, frame_max, frame_min):
    pontos = []
    total = len(data)
    passo = 360 / total
    for idx in range(0, total):
        direcao = 1
        pb = data[idx]
        diff = py5.remap(pb, frame_min, frame_max, 1, 1.3) * direcao
        angulo = idx * passo
        x0 = np.cos(py5.radians(angulo)) * mult
        x = x0 * diff
        y0 = np.sin(py5.radians(angulo)) * mult
        y = y0 * diff
        pontos.append((x0, y0, x, y))
    return pontos


def setup():
    global ALL_DATA
    py5.size(helpers.LARGURA, helpers.ALTURA, py5.P3D)
    py5.color_mode(py5.HSB, 360, 100, 100)
    py5.ellipse_mode(py5.CENTER)
    ALL_DATA = capture_sound(CAPTURAS)


def draw():
    py5.background(0)
    numero = py5.frame_count
    data_idx = MARGEM_Y
    passo = 60
    with py5.push_style():
        with py5.push_matrix():
            py5.translate(py5.width // 2, py5.height // 2, -30)
            for i in range(0, CIRCULOS):
                py5.rotate(py5.radians(numero * (1.5 + 2 * i)))
                idc = ((numero * CIRCULOS) + i) % CAPTURAS
                data = ALL_DATA[idc]
                frame_min = np.min(data)
                frame_max = np.max(data)
                pontos = circulo(((i + 1) * passo), data, frame_max, frame_min)
                for idx, (x0, y0, x, y) in enumerate(pontos):
                    h = idx % 360
                    py5.stroke(py5.color(h, 80, 80))
                    py5.line(x0, y0, x, y)
                    data_idx += 1

    helpers.write_legend(sketch=sketch, frame="#000")


def key_pressed():
    key = py5.key
    if key == " ":
        save_and_close()


def save_and_close():
    py5.no_loop()
    helpers.save_sketch_image(sketch)
    py5.exit_sketch()


if __name__ == "__main__":
    py5.run_sketch()
